01
Live network map
Feeder runs colored by their worst pole, with storm badges and live tilt popups.
Operational grid monitoring
PoleDancer puts movement and line-power sensors on your distribution poles and turns them into one operating picture. When something breaks out there, your desk knows what and where before the phones light up.
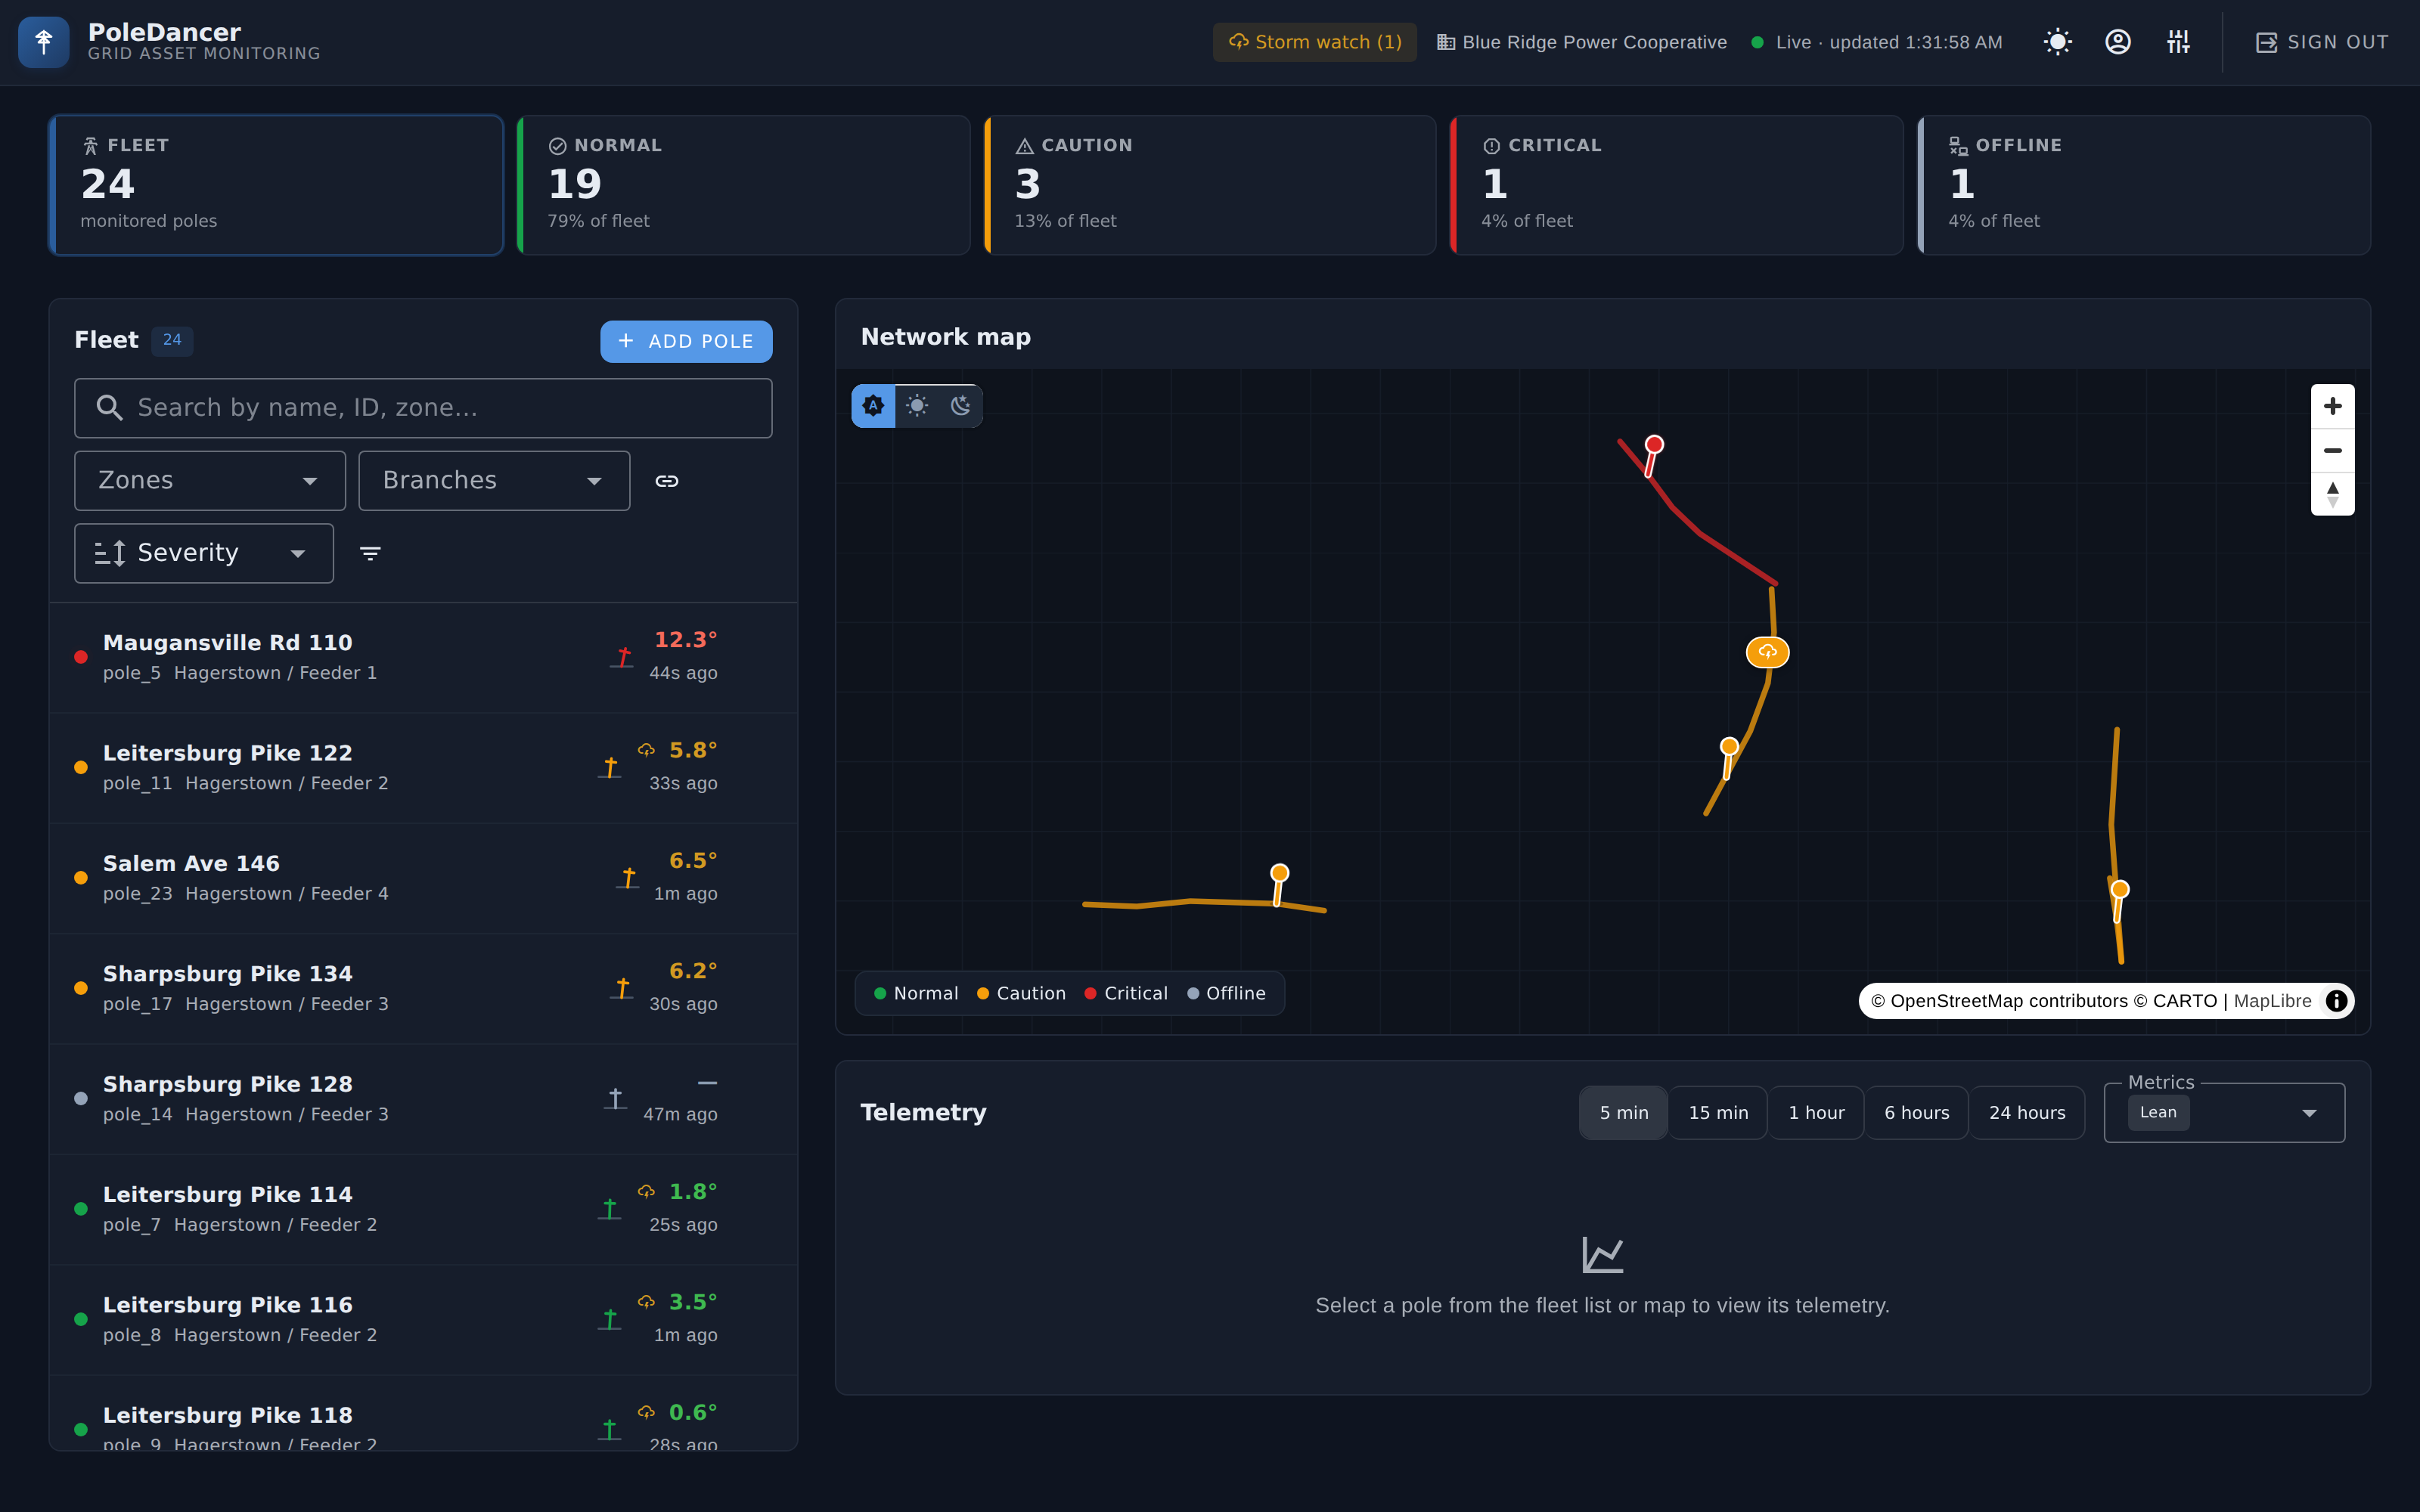
demo fleet: 24 poles, 4 feeder runs, one critical lean at 12.3°
01The console
Severity is computed the way your standards are written: lean thresholds, per-metric alert bands, and offline detection that respects each pole's reporting schedule.
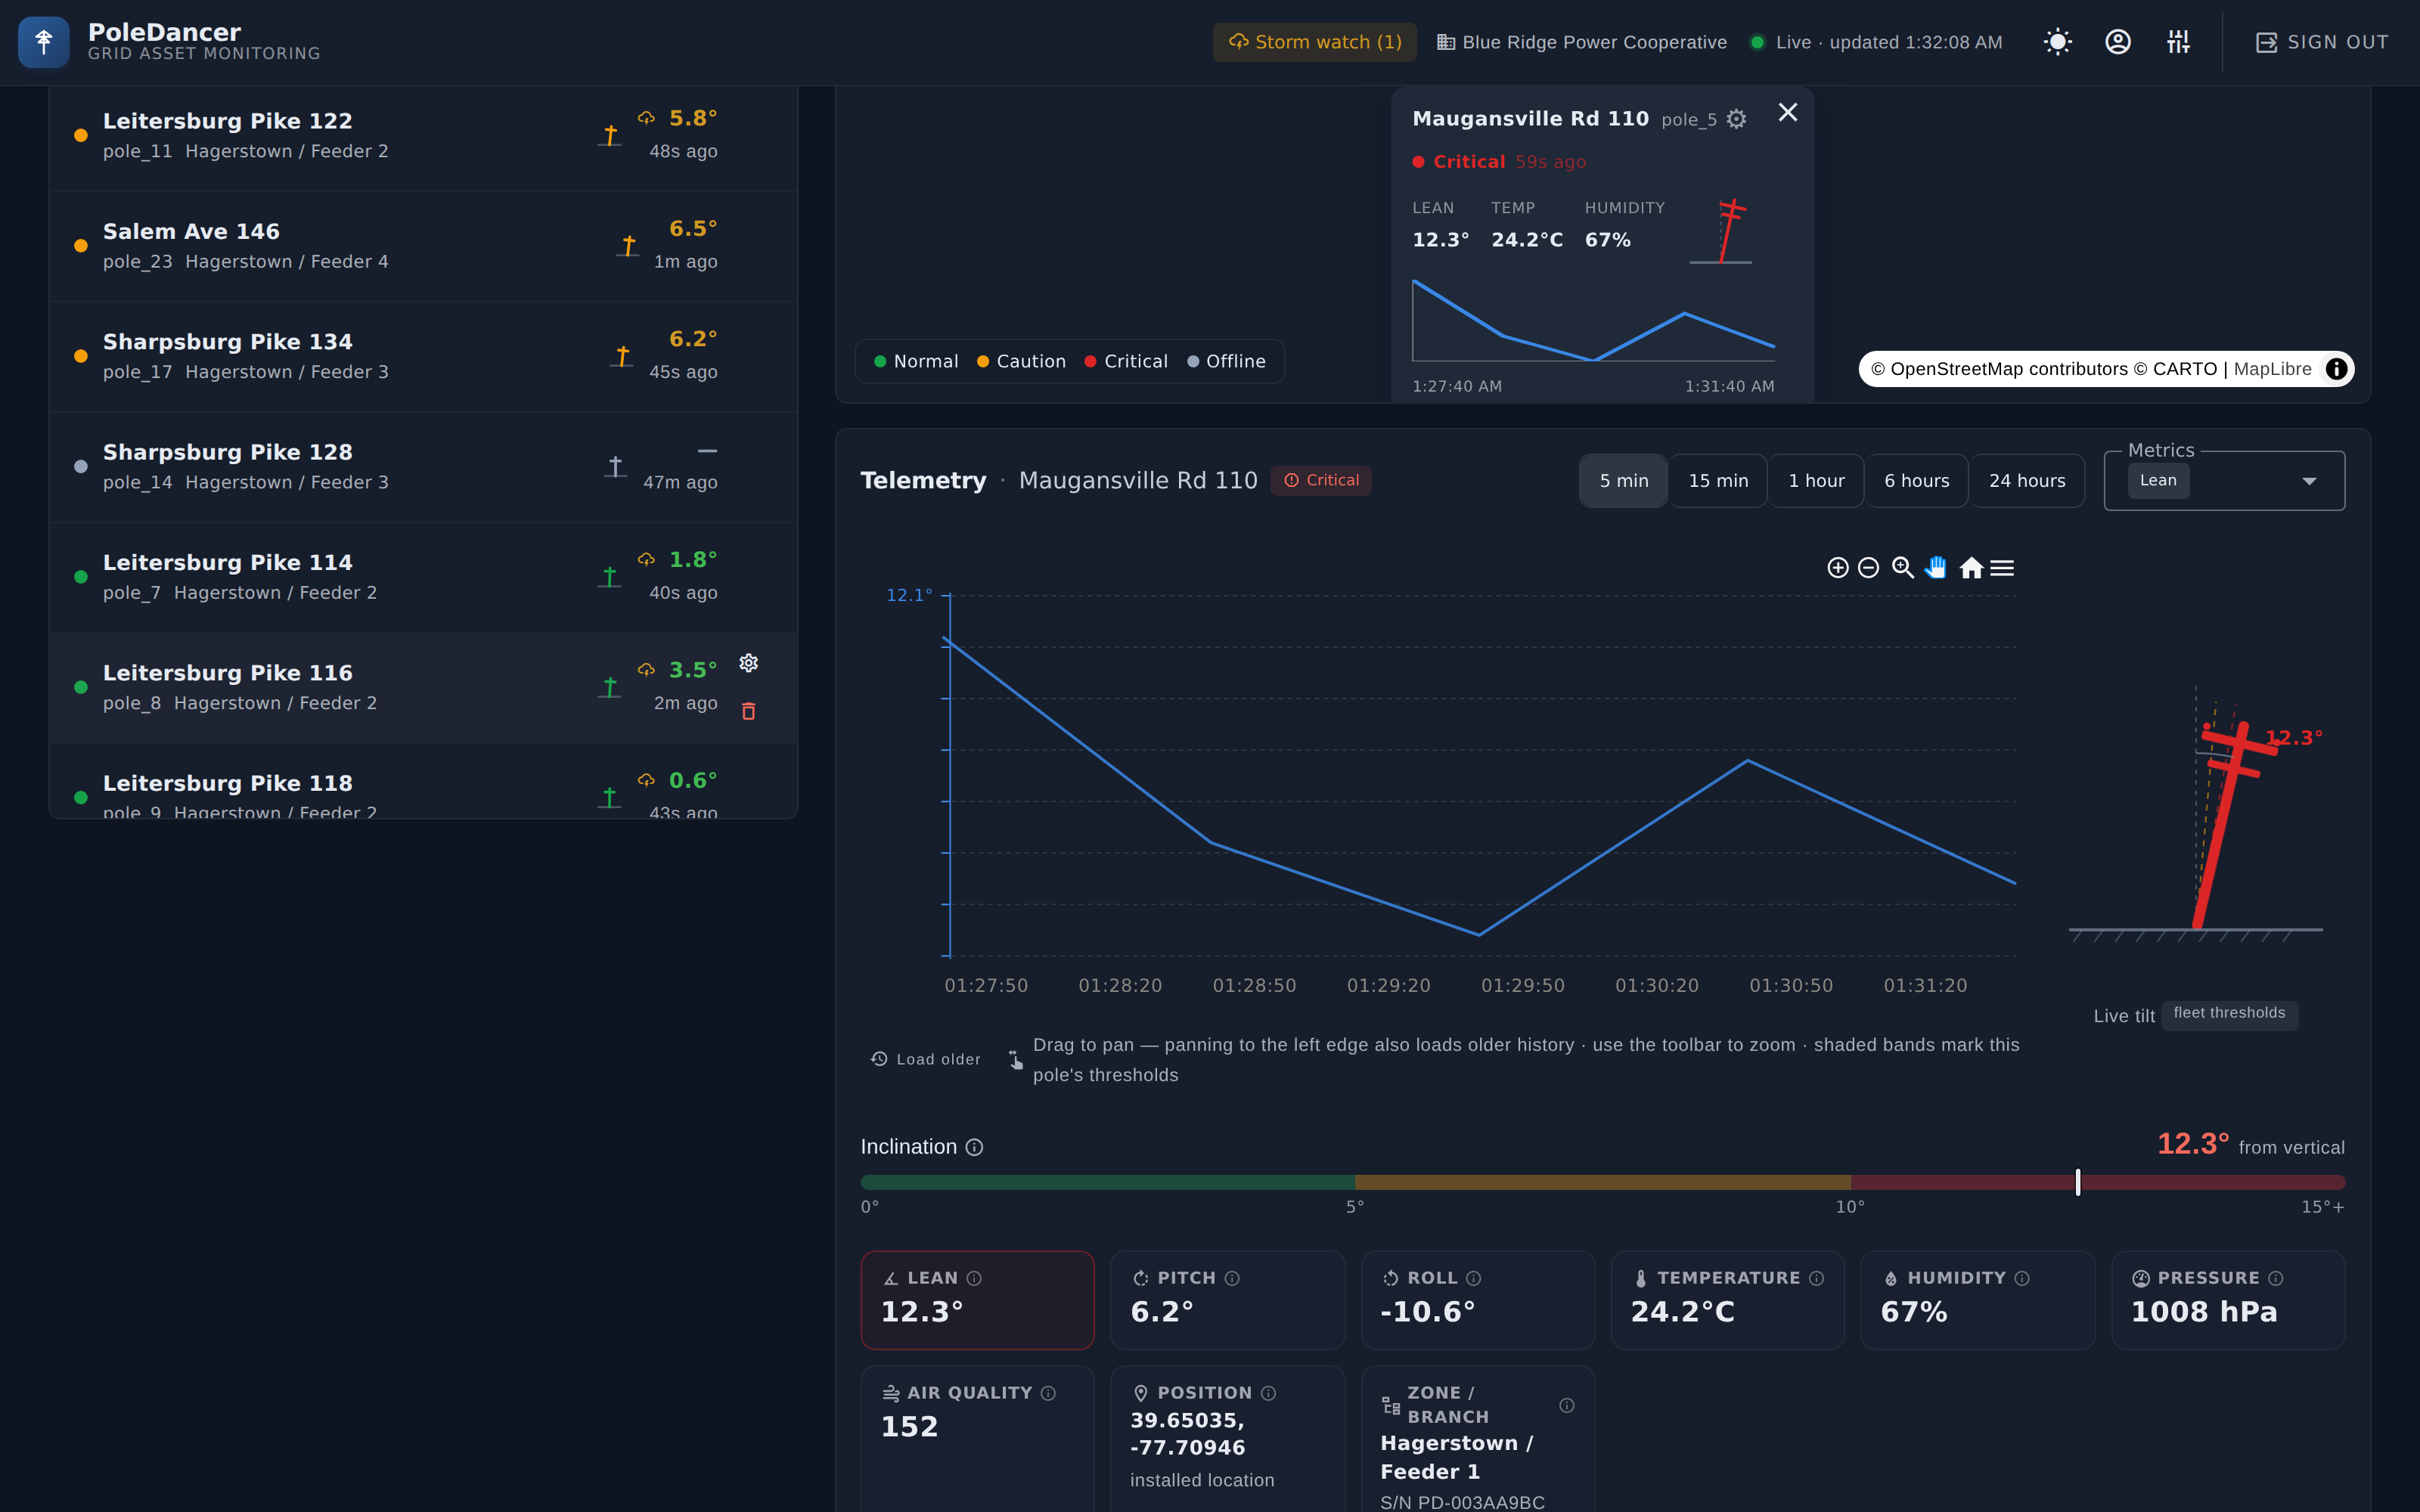
Select any pole for its live tilt drawing, threshold-banded history, and an inclination gauge against its effective thresholds.
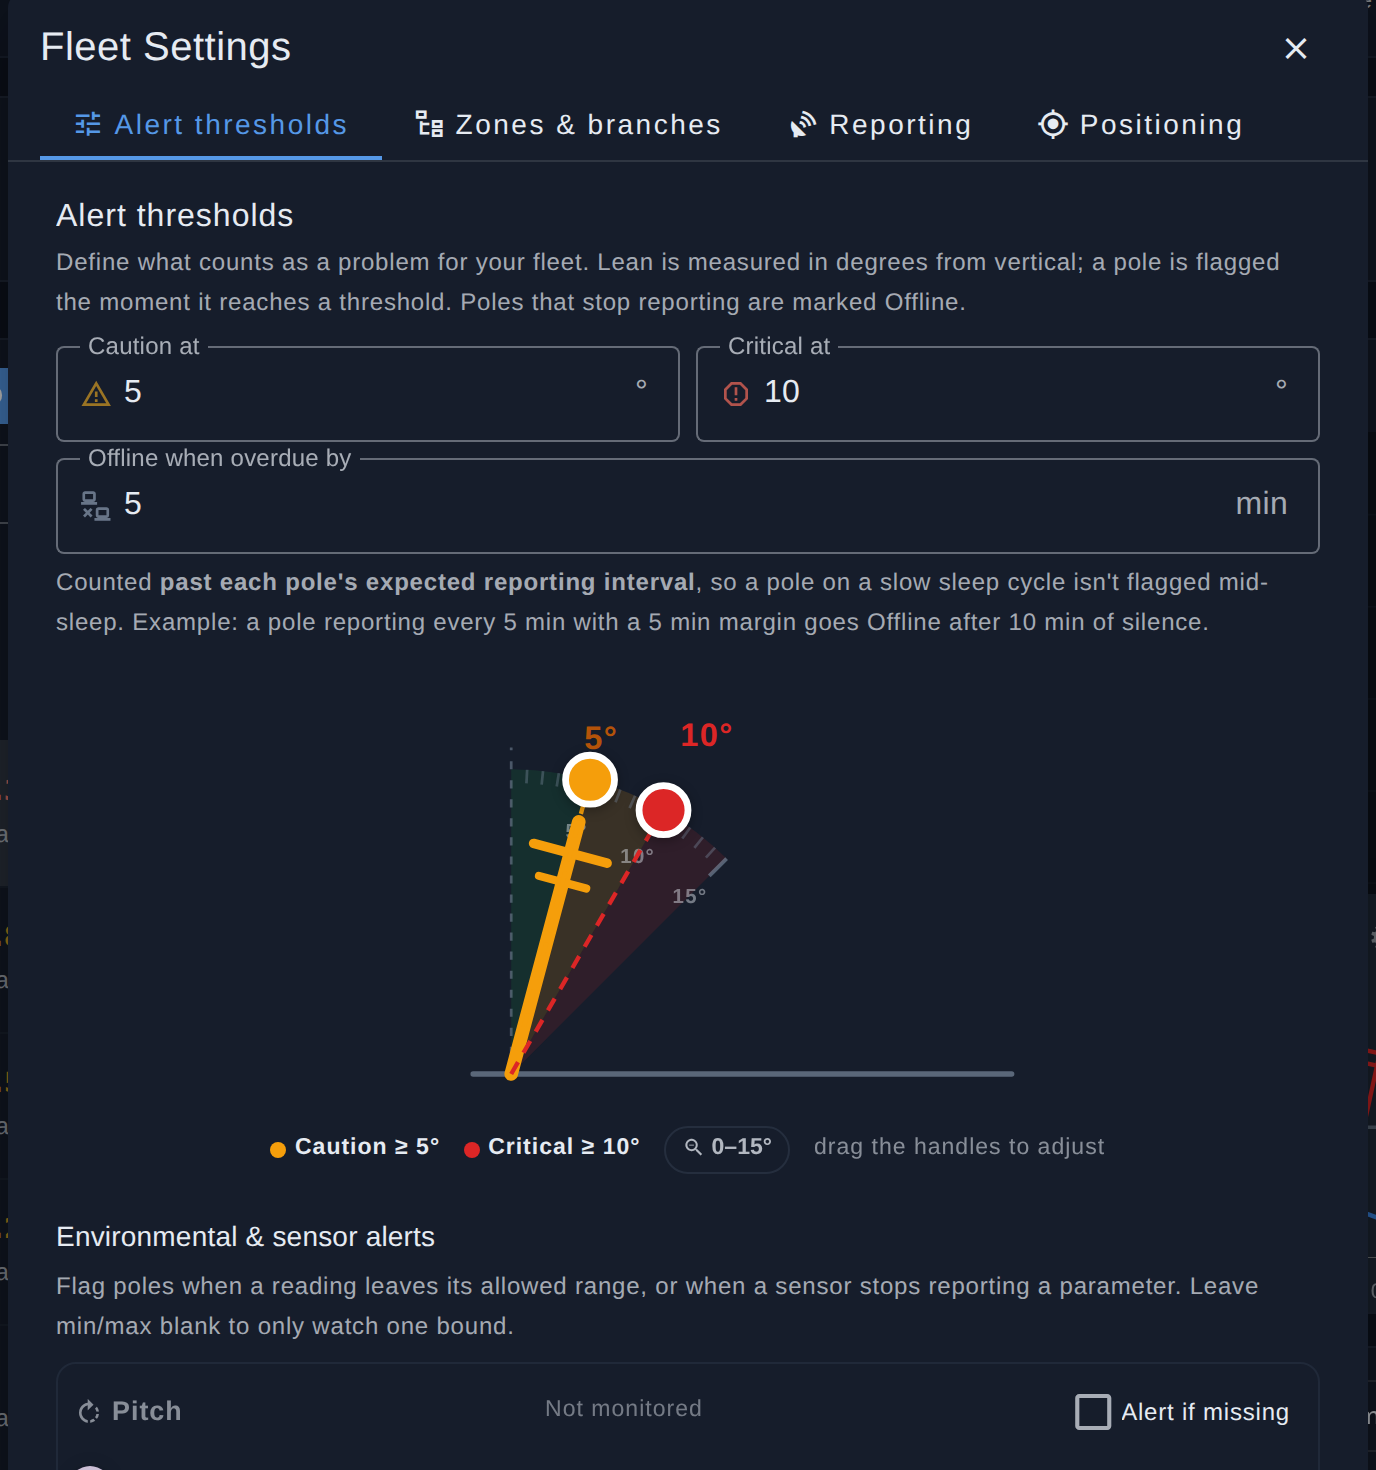
Caution and critical lean angles are set on a draggable angle picker. A 0.5° adjustment is a hand movement, not a config file.
Feeder runs colored by their worst pole, with storm badges and live tilt popups.
Fleet-wide caution and critical lean angles, with per-pole overrides for the crossing that deserves a tighter watch.
Caution and critical bands on every environmental metric, plus alerts when a channel goes quiet.
Model your territory the way you operate it. Settings inherit device → branch → zone → fleet.
Elevated reporting cadence for a branch, or the whole fleet, when weather moves in.
Offline means late against its own expected interval, not a blanket timer.
Admin, operator, and read-only roles, with a full audit trail of every change.
Email, SMS, and webhook notifications, scoped to the severities and zones each user owns.
A phone-first page per pole: navigate-to, notes, photos, mark-as-inspected.
02Predictive AI
Readings can stay within limits while a pole is steadily moving. PoleDancer's AI learns each pole's normal posture from its own history, separates weather noise from real movement, and forecasts when a drifting pole will cross your thresholds.
A footing that's letting go moves slowly. The model flags abnormal drift weeks before it becomes an alarm and projects the crossing date, while the fix is still a scheduled truck roll instead of an emergency.
03Operational value
The value is in patrol hours, outage minutes, and truck rolls. Four places it shows up, each measurable during a pilot on your own system:
Event location and pole condition reach dispatch before a crew starts the search.
measured as: crew patrol hours avoided
Faster localization can reduce restoration time and improve CAIDI. Measured during your pilot, not promised.
measured as: customer minutes interrupted avoided
The AI tracks slow structural change per pole and forecasts which poles need review before they become emergencies.
measured as: pre-failure conditions identified
Remote condition data prioritizes inspections and avoids site visits that weren't needed.
measured as: truck rolls avoided
Industry deployments of continuous grid monitoring have demonstrated substantially faster event localization and restoration. It complements periodic inspection programs rather than replacing them, and we publish no guaranteed-savings math.
04Outage detection
Every node senses whether the line above it is energized. When supply drops, the affected poles flag themselves on the map within one reporting cycle, so dispatch sees the true extent of the outage before the first customer call.
And because every node is independently powered, PoleDancer keeps watching straight through the outage.
The crew gets a pole number, not a patrol area.
05Storm watch
Storm Watch raises the reporting cadence for a branch or the whole fleet, and highlights clusters of movement, outages, and abnormal conditions as severe weather moves through.
06Hardware
Sealed, solar-powered units your crews mount during routine work. Claim the factory serial (PD-XXXXXXXX) in the console and the node is reporting from its first message.
The workhorse. One on every monitored pole.
Everything the PD-S1 senses, plus the connection out. This is the cellular gateway for nearby PoleDancer nodes.
Hardware is purchased separately from the monitoring subscription, and volume hardware pricing is available. Provisioning is by serial. No field flashing, ever.
07Deployment
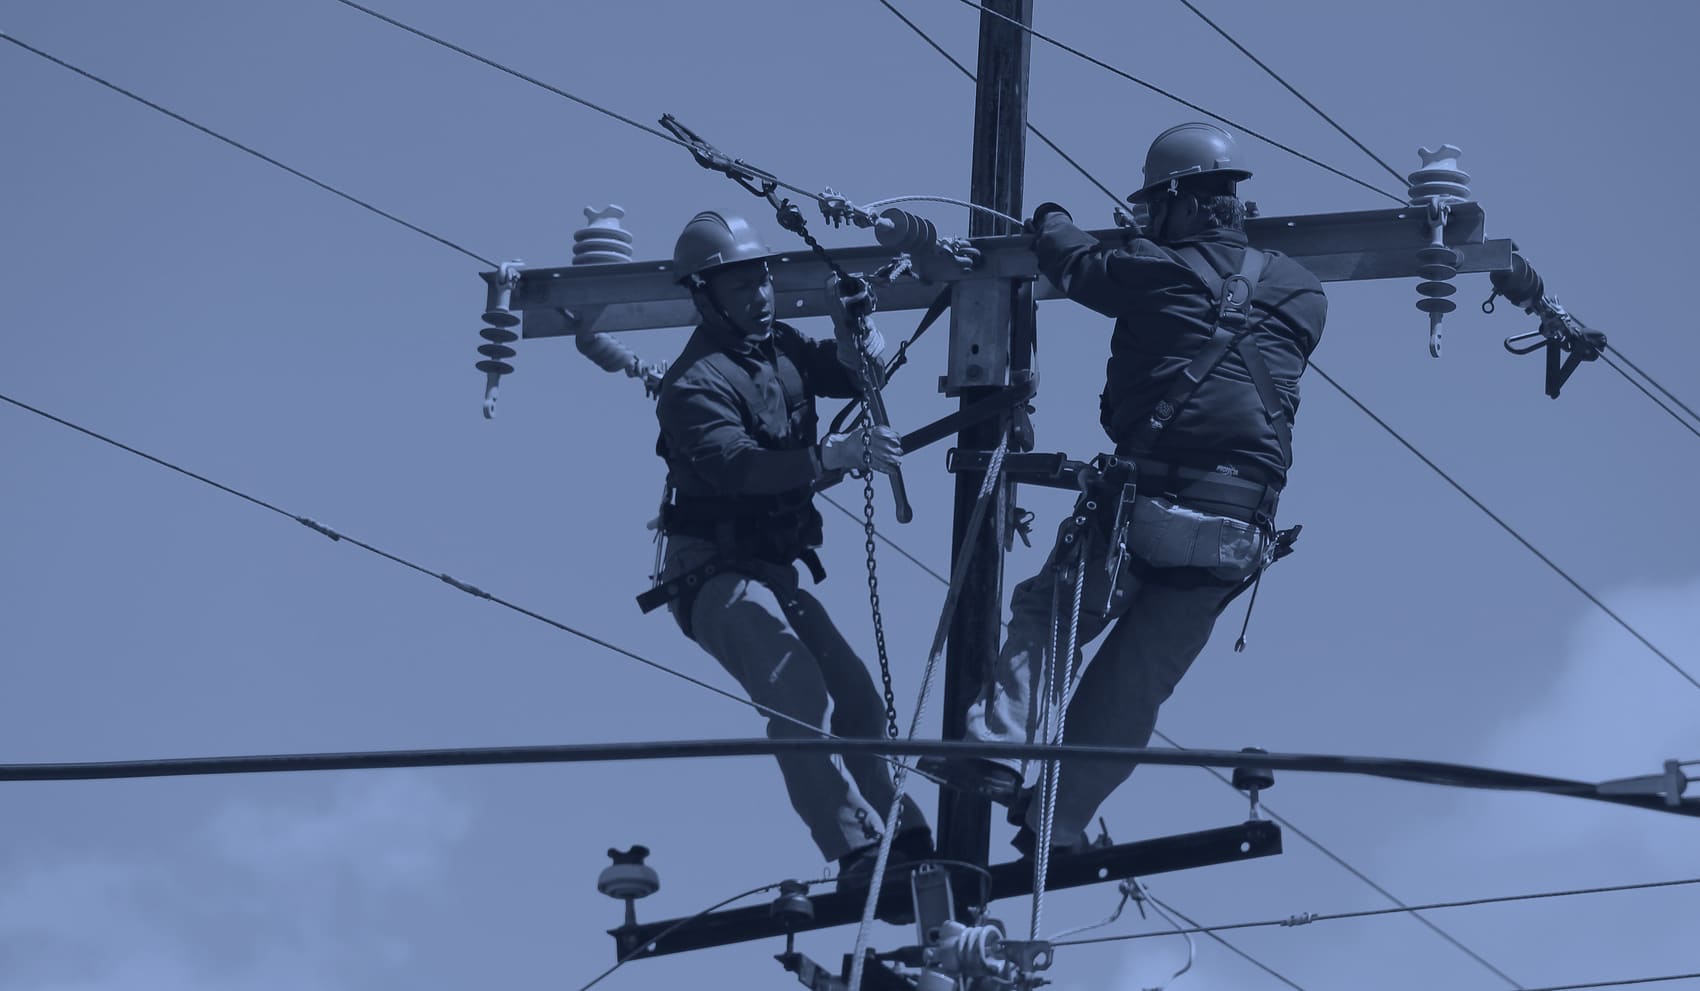
Nodes arrive provisioned and labeled. A crew mounts one below the crossarm during routine work, with no service drop and no field configuration, and the pole is reporting before the bucket is down.
08How it works
Sensors form their own radio network along the line, and one cellular node carries the whole run to the cloud. No wiring, no site survey, no IT project.
Your crew mounts it in minutes. Solar powered, so there's nothing to wire and nothing to set up in the field.
Every sensor talks to its neighbors by radio and passes their readings along the line, pole to pole.
A PD-X1 backhaul node gathers the whole run's data and sends it to the cloud over the cellular network.
Map, alerts, and history in the console. When a pole leans, loses power, or goes quiet, you know which one.
Start with the corridor
that keeps you up at night.
09Founding utility pilot
A typical pilot monitors about 50 poles across one or two feeders for six months, through real weather and real outages, and ends with a performance and ROI report you can take to leadership.
Contact us for pilot pricing. Early expansions may qualify for deployment credits.
10Pricing
Start with a targeted deployment and expand once the value is on paper. The subscription covers monitoring, communications, alerting, analytics, and history. Hardware is purchased separately.
Continuous visibility into pole condition and distribution-grid events.
$18/monitored pole/mo
Annual billing · 25-pole minimum deployment
Best for utility operations
Advanced analytics and workflow tools for utility operations teams.
$29/monitored pole/mo
Annual billing · 25-pole minimum deployment
Purchased separately from the subscription, so equipment and monitoring stay in separate budgets. Volume hardware pricing available.
Qualifying 36-month agreements can include hardware for an additional monthly charge. Operating expense instead of an up-front purchase.
Ask about managed hardwareDeploy ~50 poles, measure the operational impact, and expand on results.
Plan a pilotVolume pricing from 100+ monitored poles. Enterprise integrations, SSO, self-hosted deployment, and rollout support quoted individually.
Contact salesAnnual billing, 25-pole minimum. One PD-X1 serves a run of 15–20 poles and its cellular data is included. Hardware ships provisioned. Installation by your crews or a partner.
11Questions
No. Start where failure is expensive or likely: crossings, storm corridors, inspection-flagged poles, aging trunks. That's exactly what the pilot is scoped for.
List pricing applies from the 25-pole minimum. Deployments of 100+ monitored poles qualify for volume pricing on subscription and hardware, and larger deployments are quoted individually.
The hardware is the field instrument. The subscription is the monitoring system: cloud monitoring, cellular and mesh communications, storage, alerting, analytics, updates, and support.
Yes. Qualifying 36-month agreements can include hardware for an additional monthly charge per pole. Contact us for terms.
About 50 monitored poles on one or two feeders for six months. Hardware, provisioning, subscription, configuration, onboarding, monthly reports, and a final performance and ROI report. Contact us for pricing.
Each node senses the field radiated by the conductors above it. When that signature disappears, it reports the span de-energized. The sensors are solar-powered, so they keep reporting straight through the outage.
One PD-X1 per run of 15–20 poles, and the rest are PD-S1s. It's the only unit needing cellular coverage, its data plan is included, and we place them against a coverage map during rollout planning.
Your crews, during routine work. Units arrive provisioned and are claimed by serial. Turnkey installation can be quoted through a partner.
Storm Watch raises the reporting cadence and badges the map. As crews restore service, re-energized spans clear pole by pole.
It learns each pole's normal posture from its own history, separates weather noise from real movement, forecasts when a drifting pole will cross your thresholds, and ranks the fleet by risk. Every prediction links to the trend data behind it.
No. It shows what happens between inspections (sudden events, slow drift, line power) but it can't see below-grade decay. What it changes is which poles get looked at first.
Enterprise deployments can run the full stack on infrastructure you control, with the same per-pole subscription.
Start with a pilot on the corridor that keeps you up at night.